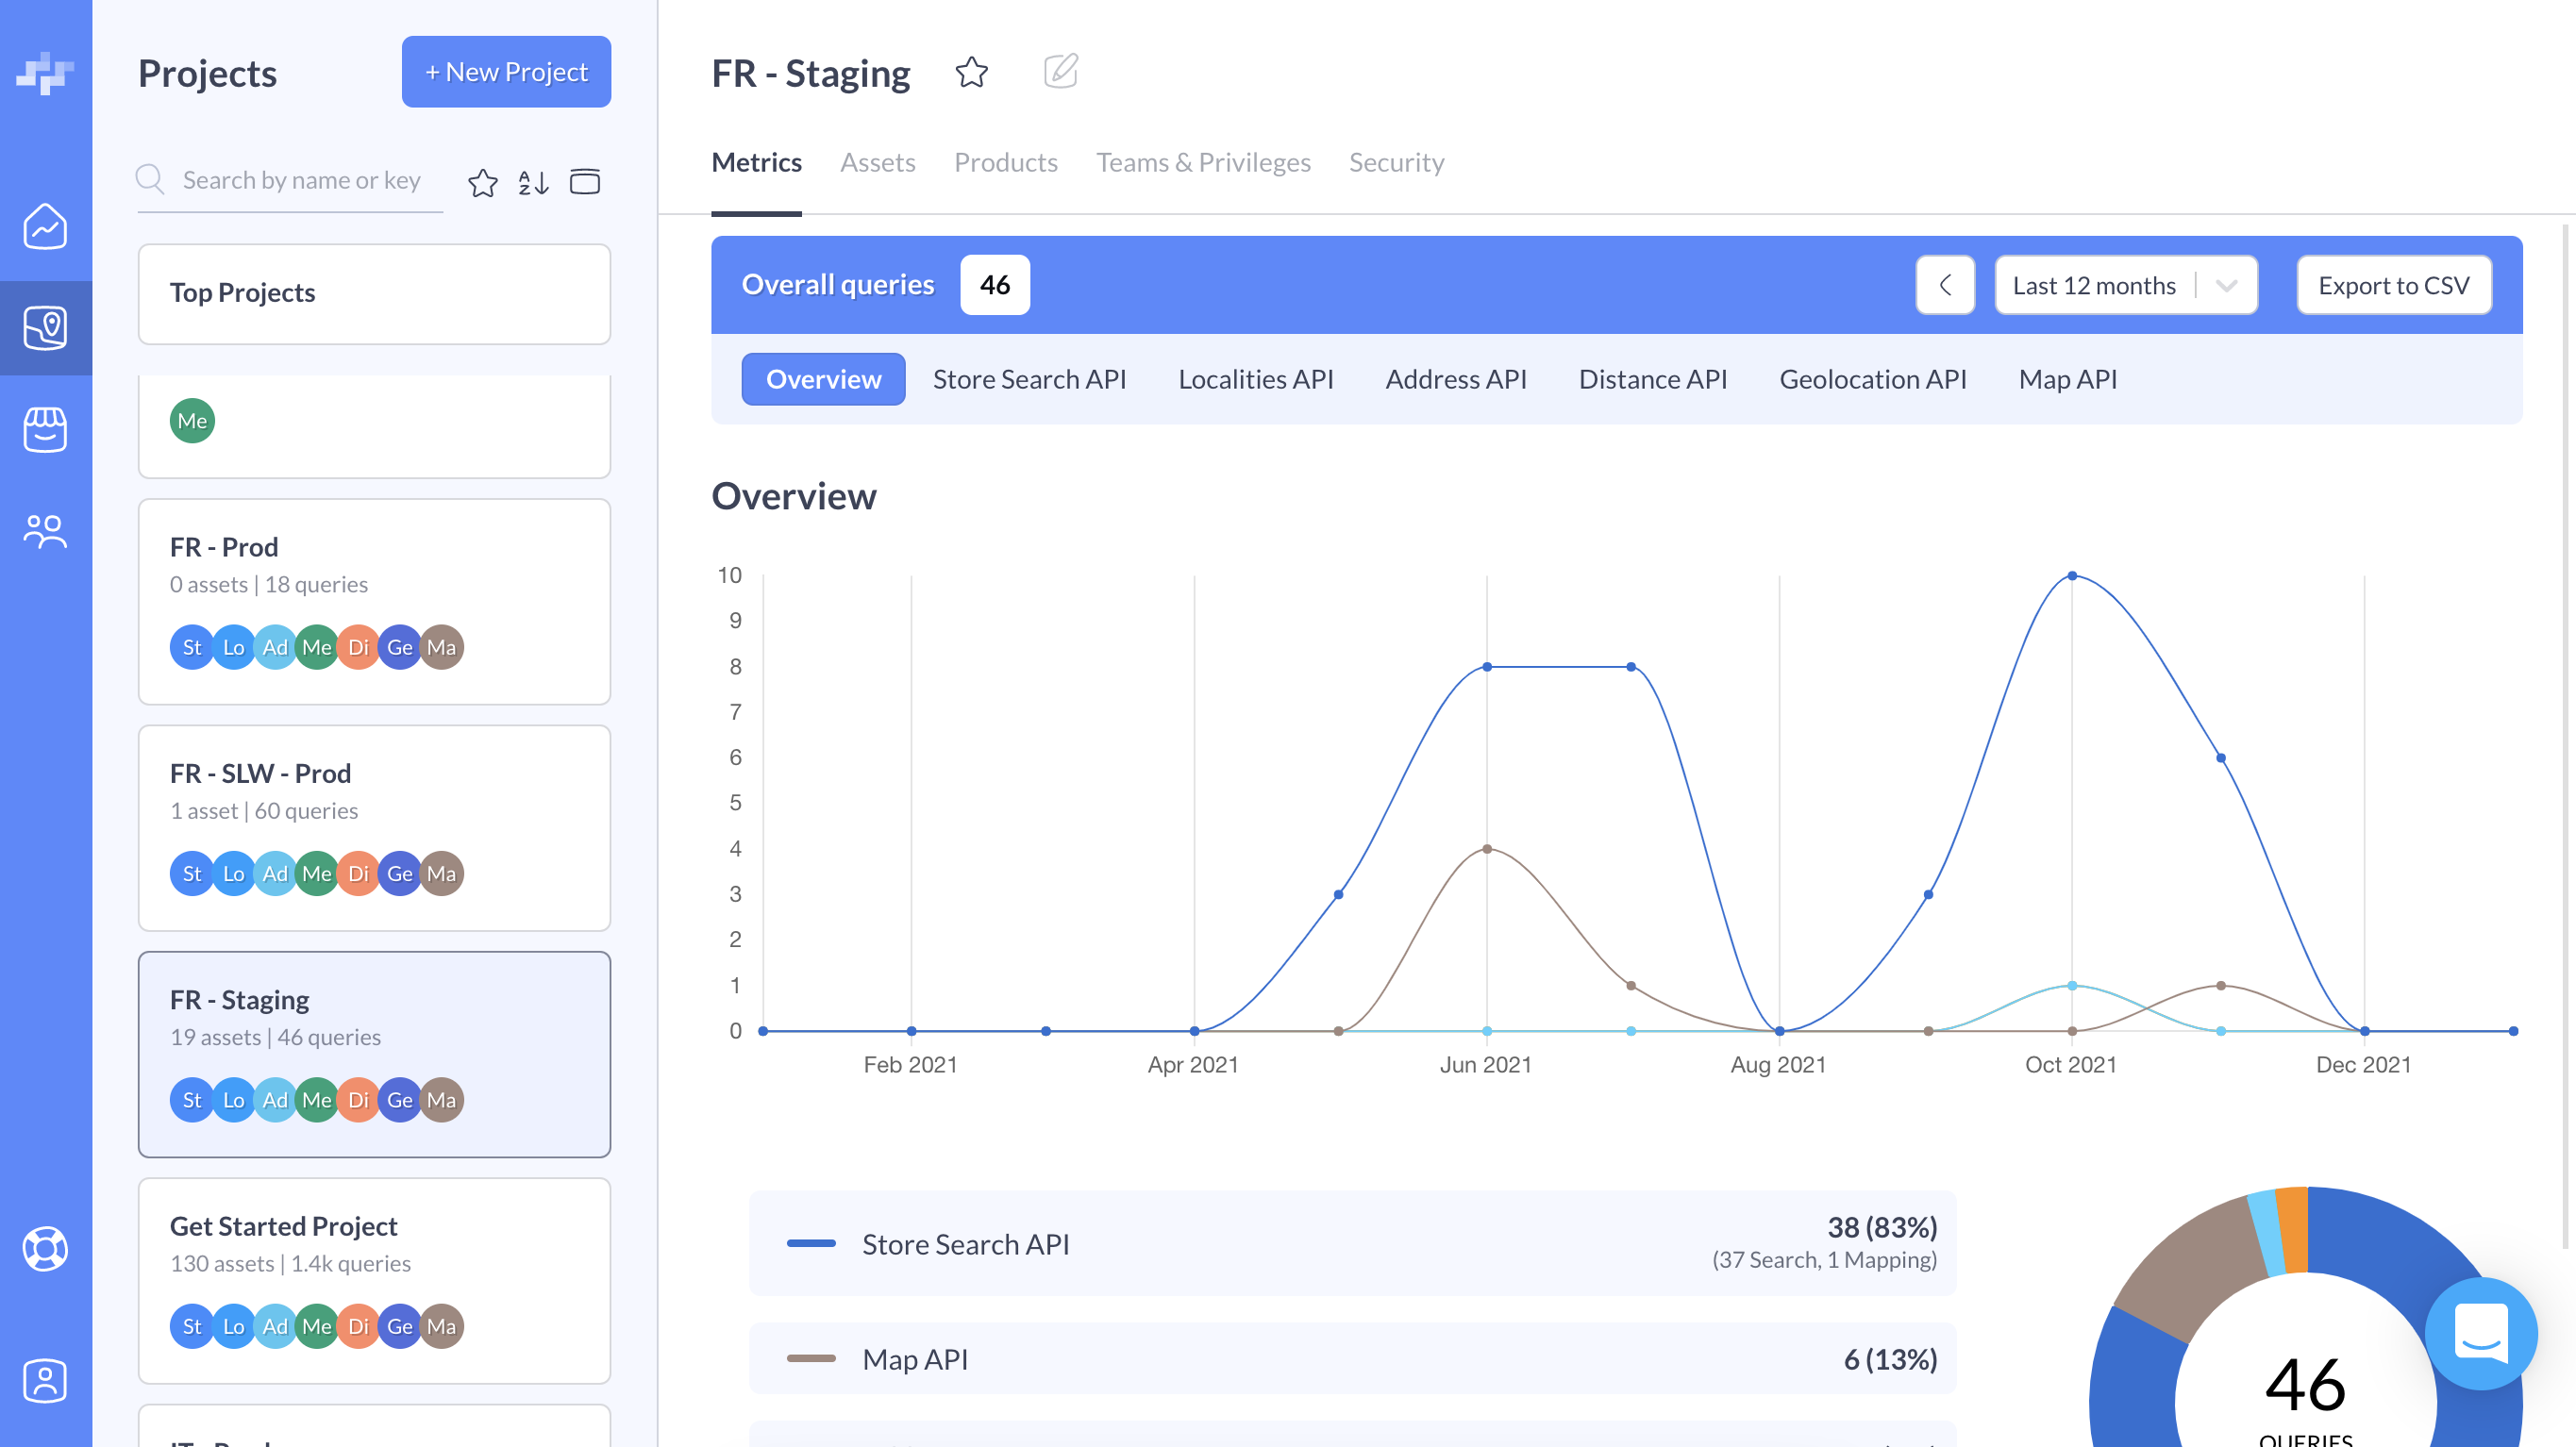
Initially, the graph displays the consumption in queries of the Products that are activated in this Project and are being requested. We told you more about it, and even listed some use cases, in the Dashboard Metrics section.
You can also export your Metrics as a CSV file in two clicks! It will take into account the timeframe you've set and the Product you've filtered if that's the case.
You can even go deeper in understanding your Project's consumption by clicking on a Product to see its Kinds' consumption.
Use cases
We've listed some use cases for the Project Metrics:
I want to know which Products have the highest consumption in this Project
I want to go deeper in understanding a Product and know its Kinds' consumption
You can easily consult Metrics from different Projects by clicking on the Project sidebar as it will remember on which tab you're on. It is actually working for each part of the Project (Products, Assets, Teams & Privileges, Security).
As logical as it may seem, you'll only see Metrics for Products that are activated in the Project. However, if a Product has been deactivated in a Project, but had made consumption before, you'll still see it in the Project Metrics, mostly in case you need to consult these data in the future and compare it with your invoices.